Distributed Environmental Sensing Networks: A Framework for Scalable Global Water Intelligence
- Melinda Chu
- Apr 28
- 9 min read

Abstract Environmental monitoring systems remain fundamentally constrained by centralized laboratory infrastructure, low-frequency sampling, and uneven global coverage. Despite decades of investment, existing approaches deliver high analytical precision but fail to provide the spatial and temporal resolution required for real-time environmental decision-making at scale.
Recent global datasets from UNEP GEMS/Water (GEMStat) illustrate both progress and persistent limitations: 50–61 million measurements from 23,000–31,000 stations across 90+ countries still represent only a small fraction of global water systems. Data availability is highly uneven, with the lowest-income half of countries contributing less than 3% of global measurements.
This paper presents a framework for distributed environmental sensing networks that leverages smartphone-based, field-deployable systems to generate scalable, high-frequency, and geolocated data. By shifting from centralized testing to distributed sensing, environmental monitoring evolves from episodic snapshots toward continuous environmental intelligence.
Microplastics / nanoplastics detection in saltwater environments serves as a representative stress test, demonstrating feasibility in one of the most complex real-world scenarios. The framework extends naturally to multi-matrix detection (water → biological samples) and broader environmental–human exposure monitoring.
This paper is also available at:
https://doi.org/10.5281/zenodo.19475218


Figure 1. Distributed Environmental Data Collection at Global ScaleSmartphone-based, field-deployable systems enable individuals across diverse geographic and environmental contexts to collect water quality data. Standardized workflows allow for consistent data capture across users, supporting scalable, decentralized monitoring beyond traditional laboratory infrastructure.
1. INTRODUCTION Environmental monitoring is essential for ecosystem protection, water-resource management, and public health policy. Yet current systems are built around centralized laboratory workflows that prioritize analytical accuracy over scalability. The result is limited geographic coverage, low sampling frequency, and delayed data availability.
UNEP GEMS/Water (GEMStat) now holds 50–61 million measurements from 23,000–31,000 stations in 90+ countries. While this reflects growth, it covers only a tiny fraction of global water bodies (e.g., just 0.0001% of the planet’s ~117 million lakes receive regular ground monitoring). Station density remains critically low: many river basins have ≤0.5 stations per 10,000 km², with Africa at ~0.02, Asia at ~0.08, and Latin America at ~0.3.
Most data come from episodic “grab sampling” (monthly or less), missing short-term pollution events such as storm runoff or industrial discharges. In the 2023 SDG 6.3.2 reporting cycle, ~2.15 million measurements were used across 120 countries, yet the lowest-income half of countries contributed <3% while the highest-income quartile supplied ~59%. This creates a global dataset dominated by well-resourced regions.
These constraints reveal a core limitation: current environmental monitoring systems are optimized for accuracy, not coverage or speed.
At the same time, a global sensing infrastructure already exists. Smartphones are used by ~5.7 billion people (~70% of the global population), with >7.5 billion devices in circulation. These devices provide high-resolution cameras, GPS, connectivity, and onboard compute — no new hardware deployment required.
This paper outlines a practical framework that turns everyday smartphones into distributed environmental sensors, enabling a shift from centralized labs to scalable, networked intelligence.
2. THE PROBLEM: CENTRALIZED MONITORING DOES NOT SCALE
Environmental monitoring systems remain heavily dependent on centralized laboratory infrastructure, high-cost instrumentation, and specialized personnel. While these approaches provide analytical precision and regulatory compliance, they are fundamentally constrained in geographic coverage, frequency, and speed.
Laboratory-based methods often require days to weeks per sample, limiting real-time decision-making
Most monitoring relies on episodic “grab sampling” (monthly or less), missing short-term pollution events such as storm runoff or industrial discharge
Monitoring systems are optimized for accuracy, not coverage or temporal resolution
Geographic limitations are particularly stark. Of the estimated 117 million lakes globally, only a negligible fraction (0.0001%) receive regular ground-based monitoring. Data collection remains concentrated in a small number of regions, leaving large portions of the world effectively unmeasured.
Key framing:
Current environmental monitoring systems are not optimized global coverage or speed to allow for real-time decision making..
3. THE DATA GAP Despite decades of effort, global water quality data remains sparse, episodic, and uneven.
- Sparse sampling globally: GEMStat (UNEP’s primary freshwater quality database) now contains more than 61 million entries (as of January 2026) from over 31,000 stations in more than 90 countries. Earlier 2024–2025 versions reported ~50 million measurements from ~23,000 stations in ~42 countries — showing rapid growth but still covering only a minuscule portion of global water systems.
- Station density remains critically low in many regions, with large basins often having ≤0.5 stations per 10,000 km².
- Episodic vs. continuous: High-frequency (sub-hourly) monitoring is rare and limited to select research or priority sites; most data stays discrete and low-resolution.
Missing data by region and type:
Developing/low-income regions: In the 2023 SDG 6.3.2 data drive (latest detailed global reporting), over 2.15 million measurements were used across 120 countries. The lowest-income half of countries (Q1 GDP quartile) contributed less than 3% (~60,000 measurements). Q1 + Q2 together provided only ~2.9% of the total. The highest-income quartile alone supplied ~59% (~1.27 million). Poorest countries reported on just ~3.5% of monitored water bodies. By 2030, the health and livelihoods of ~4.8 billion people could be at risk if monitoring rates do not improve.
Coastal regions: Inland and marine monitoring remain fragmented; coastal zones (home to ~40% of the global population) face heavy land-based pollution inflows but have limited dense, long-term in-situ stations.
Distributed infrastructure: Stations cluster around urban areas and major rivers. Rural/decentralized systems, small lakes, reservoirs, wells, and community sources (relied on by billions) are severely under-monitored. Lakes and groundwater lag far behind rivers despite their critical role in drinking water and ecosystems.
Consequences Sparse + episodic + uneven data → incomplete situational awareness, delayed response, and ineffective policy.
4. ENABLING LAYER: SMARTPHONES AS DISTRIBUTED SENSORS
The primary barrier is no longer sensing capability — it is deployment scale.
Smartphones already deliver:
High-resolution imaging
Precise geolocation
Network connectivity
Onboard compute
This existing infrastructure requires no new hardware, no centralized facilities, and no specialized operators.
Around 68-70% of the world's population has a smartphone as of early 2026. This equates to roughly 5.65–5.78 billion smartphone users out of a global population of about 8.3 billion.
Note that "users" typically refers to unique individuals, while the total number of active smartphones/connections is higher (~7.5–8+ billion) because many people own multiple devices.
Growth has been rapid: From 4.88 billion users (60%) in 2024 to the current levels, driven by affordable devices in emerging markets like India and Africa.
Every individual with a smartphone can become a distributed collector of water intelligence.
Key framing: The sensing infrastructure and scale already exists — the missing layer is the application.
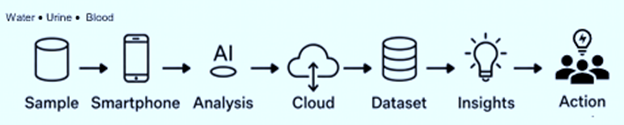
5. SYSTEM ARCHITECTURE: FIELD-TO-DATA PIPELINE
The framework uses a standardized, repeatable pipeline designed for minimal user variability and machine-readable outputs:
Sample → Reaction → Imaging → Computer Vision → Geolocated Data Layer
Sample & Reaction User collects a water sample and applies a pre-packaged, single-use reagent kit. The reaction produces a visible or fluorescent signal specific to the target analyte (e.g., microplastics, PFAS, heavy metals). Kits are designed for field use with no refrigeration or complex training required.
Smartphone Imaging The phone camera (or simple clip-on adapter) captures the reaction result under consistent lighting conditions. Built-in guidance ensures proper framing and focus.
Computer Vision / AI Analysis A custom model (on-device or cloud) processes the image to quantify the signal, classify particles or concentrations, and apply quality checks. Results are generated in seconds with uncertainty estimates.
Secure Data Layer Each measurement is automatically timestamped, geolocated, and uploaded to a cloud platform. Individual tests aggregate into structured time-series datasets, enabling real-time maps, trend analysis, anomaly detection, and population-level exposure insights.
The pipeline is deliberately lightweight and standardized, allowing anyone — from community members to field technicians — to contribute high-quality data.
Figure 2: Field-to-Data Pipeline
6. CASE STUDY: MICROPLASTICS / NANOPLASTICS IN SALTWATER (OCEANS) Microplastics detection in saltwater provides a rigorous stress test. Saltwater matrices introduce high ionic strength, suspended particulates, organic matter, biofouling, and tidal variability.
Microplastics themselves are heterogeneous in size, shape, and polymer type.
Existing centralized lab methods cannot scale to capture spatial or temporal dynamics in dynamic coastal environments. The distributed smartphone-based approach succeeds by enabling high-frequency, geolocated sampling exactly where land-based pollution enters oceans.
Key framing: Microplastics in saltwater represent one of the most challenging real-world detection problems — and therefore a critical validation case for scalable environmental sensing.
7. FIELD VALIDATION: DIRECT DEPLOYMENT WITHOUT LAB INFRASTRUCTURE
Field testing was performed directly in real-world coastal environments without reliance on laboratory infrastructure, specialized equipment, or controlled conditions.

Water samples were collected and analyzed on-site using a simple, standardized workflow, demonstrating that environmental detection can be performed outside of traditional lab settings.
This approach eliminates the need for sample transport, centralized processing, and delayed analysis, enabling immediate interaction with environmental data at the point of collection.
The field environment introduces variability not present in laboratory conditions, including:
ambient lighting differences
uneven surfaces
environmental particulates and background noise
user-driven variability in handling and positioning
Despite these factors, the system was designed to operate under such conditions, prioritizing robustness and consistency over tightly controlled inputs. This reflects a deliberate shift from laboratory optimization toward field-first system design, where real-world variability is treated as a primary design constraint rather than a limitation.
The image shown (Figure 3 above) illustrates a representative coastal sampling scenario, where water is collected and processed directly at the site. No external instrumentation, sample preparation infrastructure, or laboratory validation steps are required to generate an analyzable signal.
Key implication:Environmental monitoring can transition from centralized, episodic workflows to continuous, distributed data collection performed directly in the field.
8. DATA LAYER: FROM INDIVIDUAL TESTS TO NETWORKED INTELLIGENCE Individual measurements become valuable only when aggregated. The platform transforms raw test results into:
Interactive global maps
Longitudinal trends
Anomaly and hotspot alerts
Population-level exposure insights
This layer supports environmental and public-health surveillance, regulatory monitoring, and citizen-science initiatives.
9. APPLICATIONS & GLOBAL DEPLOYMENT The framework enables coastal monitoring, aquaculture, ports, urban water systems, and citizen-science programs. A hub-and-spoke model (e.g., regional hubs in high-density areas like Singapore/ASEAN) allows rapid scaling while maintaining local relevance.
10. LIMITATIONS This approach delivers screening-level, high-coverage data. Variability across environmental matrices is managed through standardized kits and AI quality controls.
11. CONCLUSIONScalable environmental protection requires scalable measurement. Centralized laboratory systems, while precise, cannot meet the coverage and speed demands of today’s global challenges.
Distributed sensing networks — powered by the billions of smartphones already in people’s hands — provide the missing infrastructure layer. By turning everyday devices into environmental sensors, we enable continuous, geolocated, and participatory data generation.
The result is a new model of environmental intelligence: accessible, real-time, and globally deployable. Microplastics/nanoplastics detection in complex saltwater environments proves the framework works in the hardest cases and lays the foundation for multi-matrix (water + biological) monitoring.
Scalable environmental protection requires scalable measurement — and measurement now requires distributed sensing systems.
References
UNEP GEMS/Water. (2026). GEMStat database – Global freshwater quality archive. https://gemstat.org (Data as of January–February 2026: 50–61 million measurements from 23,000–31,000 stations across 42–90+ countries, depending on the release version).
UN-Water / UNEP. (2024). Progress on Ambient Water Quality – Mid-term status of SDG Indicator 6.3.2 and acceleration needs. https://www.unwater.org/publications/progress-ambient-water-quality-2024-update (2023 data drive: ~2.15 million measurements from 120 countries; lowest-income half of countries contributed <3% (~60,000 measurements); highest-income quartile contributed ~59%; poorest countries reported on ~3.5% of monitored water bodies; projected risk to health and livelihoods of up to 4.8 billion people by 2030 if monitoring rates do not improve).
Verpoorter, C., Kutser, T., Seekell, D. A., & Tranvik, L. J. (2014). A global inventory of lakes based on high-resolution satellite imagery. Geophysical Research Letters, 41(18), 6396–6402. https://doi.org/10.1002/2014GL060641 (Global estimate of ~117 million lakes >0.002 km²).
UN-Water. (2025). Water Facts (September 2025). https://www.unwater.org/sites/default/files/2025-09/UN-Water_Water_Facts_one_pager_September2025.pdf (44% of household wastewater and 38% of industrial wastewater not safely treated).
GSMA. (2026). The Mobile Economy 2026. https://www.gsma.com/mobileeconomy/ (Approximately 5.7 billion smartphone users worldwide (~70% of global population) and >7.5 billion devices in circulation).
Pew Charitable Trusts & Systemiq. (2025). Breaking the Plastic Wave 2025. https://www.pew.org/en/research-and-analysis/reports/2025/12/breaking-the-plastic-wave-2025 (Global plastic pollution projected to double from 130 million tons in 2025 to 280 million tons by 2040; microplastics form a growing share of the total).
Marfella, R., Prattichizzo, F., Sardu, C., et al. (2024). Microplastics and Nanoplastics in Atheromas and Cardiovascular Events. New England Journal of Medicine, 390(10), 900–910. https://doi.org/10.1056/NEJMoa2309822
This paper is also available at: https://doi.org/10.5281/zenodo.19475218


Comments